
Correlates of Federal Permitting for Environmentally Impactful Projects
Correlates of Federal Permitting for Environmentally Impactful Projects
CDDRL Research-in-Brief [4-minute read]

Introduction and Contribution
American bureaucracies are frequently criticized for impeding the delivery of both public infrastructure and private development projects, wrapping them in the “red tape” of regulatory procedures. Of course, bureaucratic oversight is necessary to ensure public accountability, enable stakeholder input, and respond to market failures. It is hard to imagine how, for example, the natural environment could be protected from exploitation without regulation. Yet disagreement persists about whether the current regulatory landscape strikes the right balance between oversight and efficiency.
The National Environmental Policy Act (NEPA) of 1970 is one of the most significant federal administrative laws and is foundational to American environmental law. Per its objective of protecting the environment, NEPA requires agencies to assess the environmental impacts of major federal projects. These include construction, energy, water, and public lands projects.
NEPA’s highest level of review is the Environmental Impact Statement (EIS), which requires substantial time and scientific expertise to complete. Accordingly, the EIS process has been criticized for causing project delays. This critique is plausible at first glance: average EIS reviews now take over four years to complete and often produce documents over 600 pages long (over 1,000 pages including appendices).
Despite criticism over NEPA procedures, little is known about why some EISs take longer to be approved than others. Answering this question is important for assessing whether American bureaucracies can adequately balance the oversight-efficiency tradeoff.
In “A hazard analysis of federal permitting under the National Environmental Policy Act of 1970,” Michael Bennon, Daniel De La Hormaza, and R. Richard Geddes present findings on the correlates of EIS permitting. Using a dataset of nearly 1,300 EISs, the authors show that major construction projects and those occurring in states with more restrictive environmental laws are associated with longer permitting times. By contrast, privately financed projects are permitted more quickly. These findings will likely cohere with readers’ intuitions, namely that (a) more demanding regulations increase approval times and (b) private economic interests have the resources to navigate regulatory environments.
The authors’ findings are relevant not only for those interacting directly with NEPA. Indeed, as illustrated in their analysis of the 2009 American Recovery and Reinvestment Act, lengthy environmental reviews can make it difficult to quickly undertake new infrastructure projects when they are needed — as was the case following the Great Recession.
Data, Methods, and Hypotheses
The authors’ dataset includes 1,269 EIS reviews. Of these, 1,161 reached a Record of Decision (ROD), the federal agency’s final decision. The average duration of time from a Notice of Intent (NOI — i.e., the intent to undertake an EIS) to ROD was 4.5 years, and the median was 3.6 years. This underscores the time required for projects to complete environmental review under NEPA.
The authors include variables for (1) major construction and infrastructure projects, which comprise about half of the data set; (2) projects backed by private investors; (3) states with restrictive environmental laws, defined, for example, in terms of whether uninjured parties can challenge projects in court or whether private actions require environmental review; and (4) inclusion in the “federal permitting dashboard,” which was created in 2015 with the goal of improving the efficiency of large projects.
To measure the correlates of EIS permitting, the authors use a “Cox proportional hazards model,” a statistical method for estimating how different variables affect the time until an event happens. For example, hazard models are often used to measure how different medical treatments affect patient mortality. For the authors’ purposes, a lower hazard rate indicates a longer permitting duration.
The authors first hypothesize that larger projects will take longer to approve. This may be the case because such projects tend to attract greater stakeholder engagement, opposition, and litigation. Projects in states with more restrictive environmental laws, as well as those requiring supplemental EISs, are also hypothesized to take longer to approve. In addition, private financing ought to lead to faster approvals because private funders have the incentives and resources to expedite permitting. So too should the permitting dashboard decrease permitting times, consistent with its efficiency-maximizing objectives.
Findings
As mentioned, the authors find that major construction and infrastructure projects have significantly longer permitting times, averaging 5.2 years.
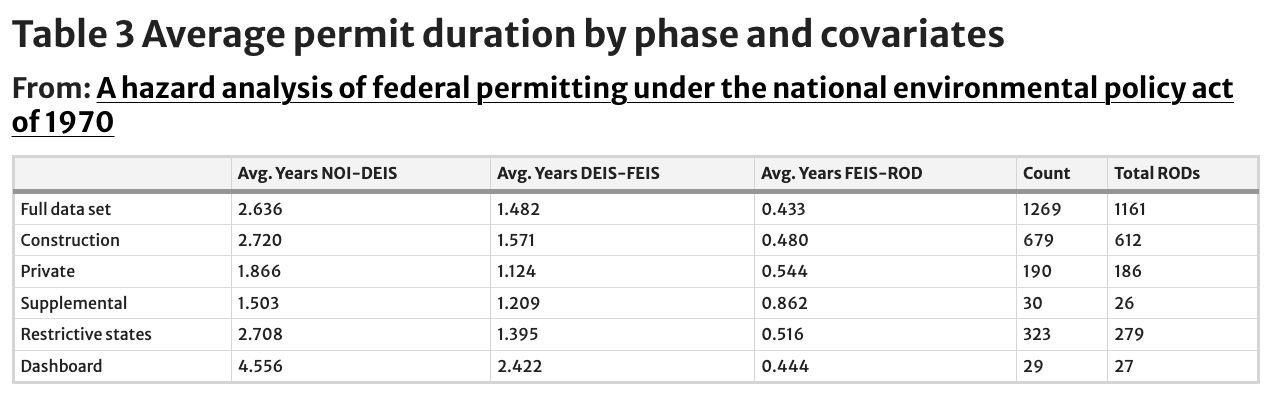
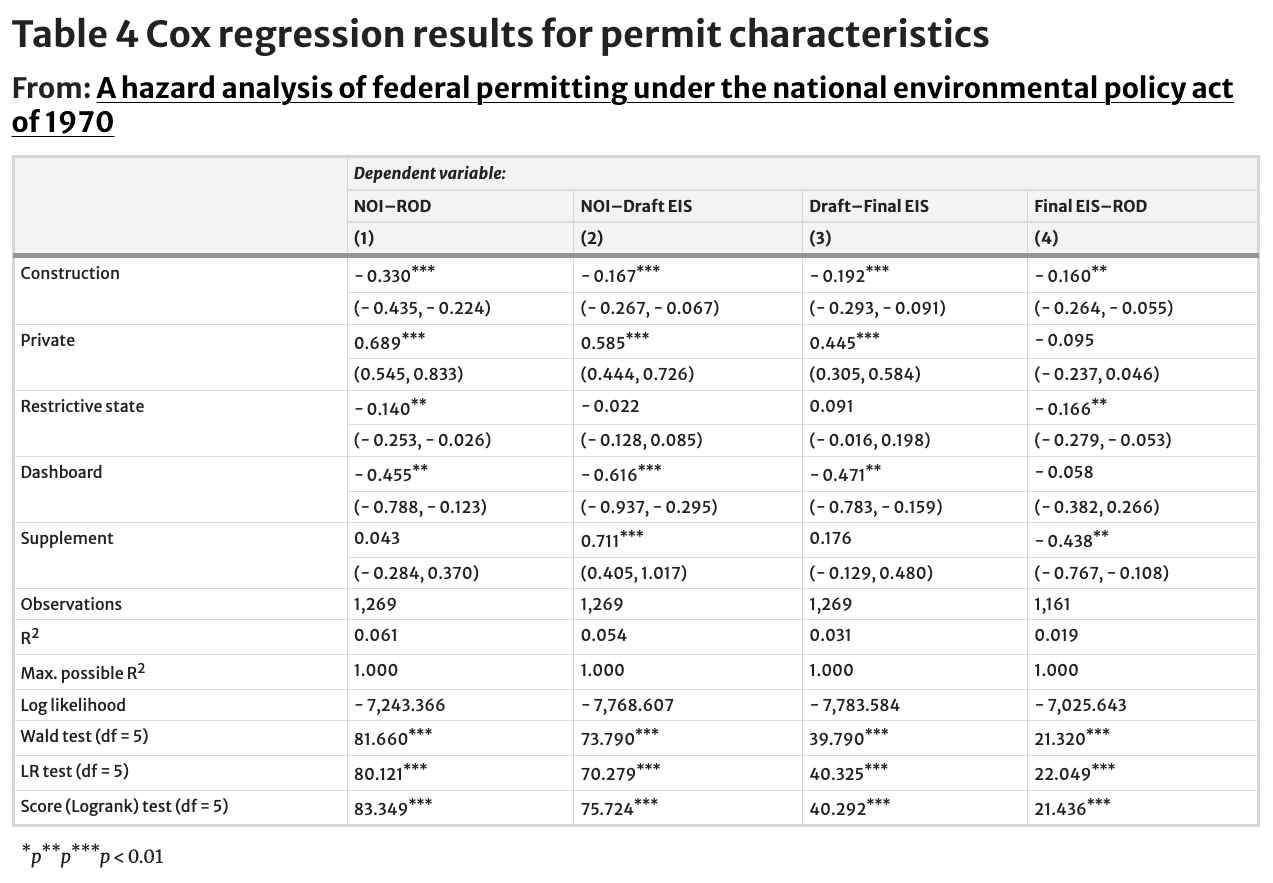
Conversely, privately financed projects are indeed found to be approved more quickly, taking an average of just 3.7 years. Meanwhile, projects in states with restrictive environmental laws, such as California, New York, and Washington, are found to take longer. Contrary to the authors’ expectations, however, projects included in the federal permitting dashboard face longer permitting times. This may reflect selection bias, or the fact that projects placed on the dashboard tend to be especially large or complex. In terms of page count, longer EISs are associated with longer permitting times and longer delays.
Finally, the authors examine permit completion rates by federal agencies, finding an average of 3 RODs per week. This rate is generally stable over time, though it spiked during Donald Trump’s election in 2016 and his inauguration in early 2017. Ultimately, the findings suggest that permitting duration is shaped not only by technical regulations but also by differences in economic resources, political conflict over projects, and federalism.
*Brief prepared by Adam Fefer.